I was missing the ability to measure and visualise the energy consumption in my smarthome. For this reason I developed a smartmeter / energymonitor as an extension for the Raspberry Pi, which I would like to share for rebuild / improvement / expansion. The piMeter.
The Smartmeter can record the following data in 3 phases:
Current RMS
Voltage RMS
Active power
Apparent power
Reactive power
Accumulated active power
Accumulated apparent power
Accumulated reactive power
All smartmeter data is visualised on a web front-end. It shows consumption data for a given day, month or year. It can also display real-time data of actual consumption. The real-time data is stored in the RAM. It keeps 10 minutes of data in a buffer and sends it to the browser when needed. The long-term data is stored in a mariaDB on my NAS. Storing this data directly on the Pi is not recommended due to the high read/write cycles on the sd card.
The smartmeter is based on the ADE9000 chip from Analog Devices, which communicates with the Raspberry Pi via SPI. For the current measurement I use SCT-013-000 current transformers from YHDC. They are cheap and can measure currents up to 100A.
Web Frontend
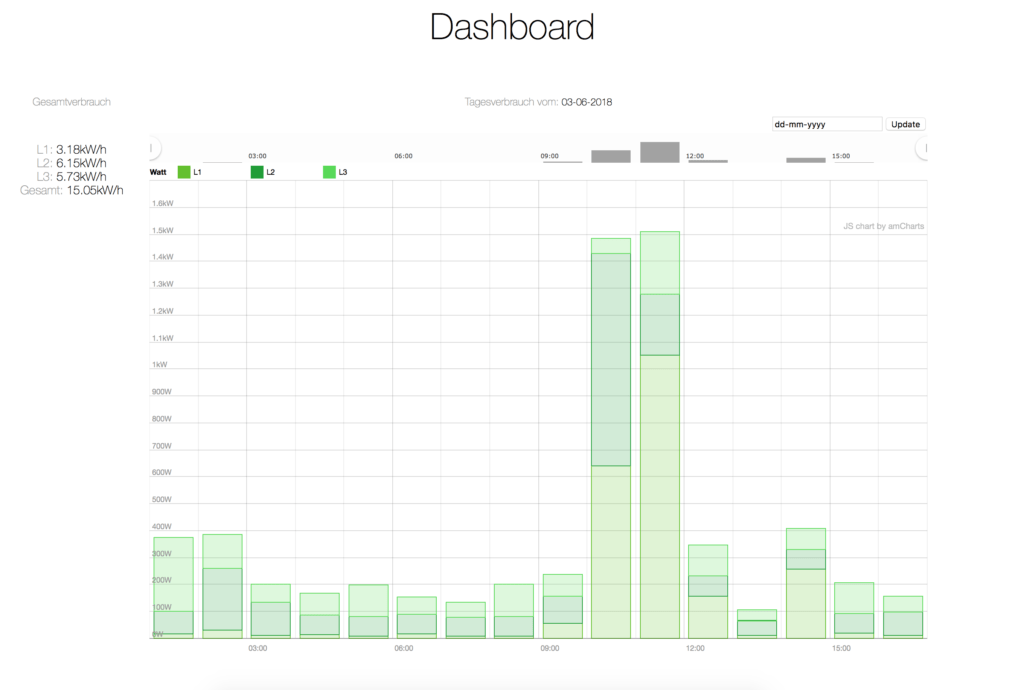
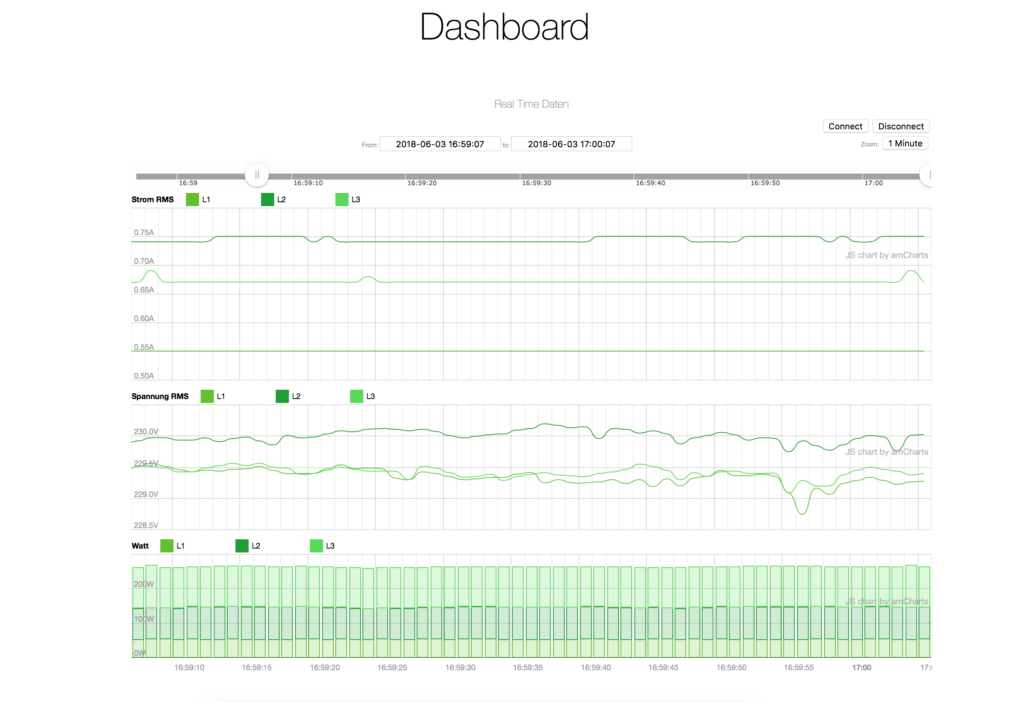
Smartmeter Board
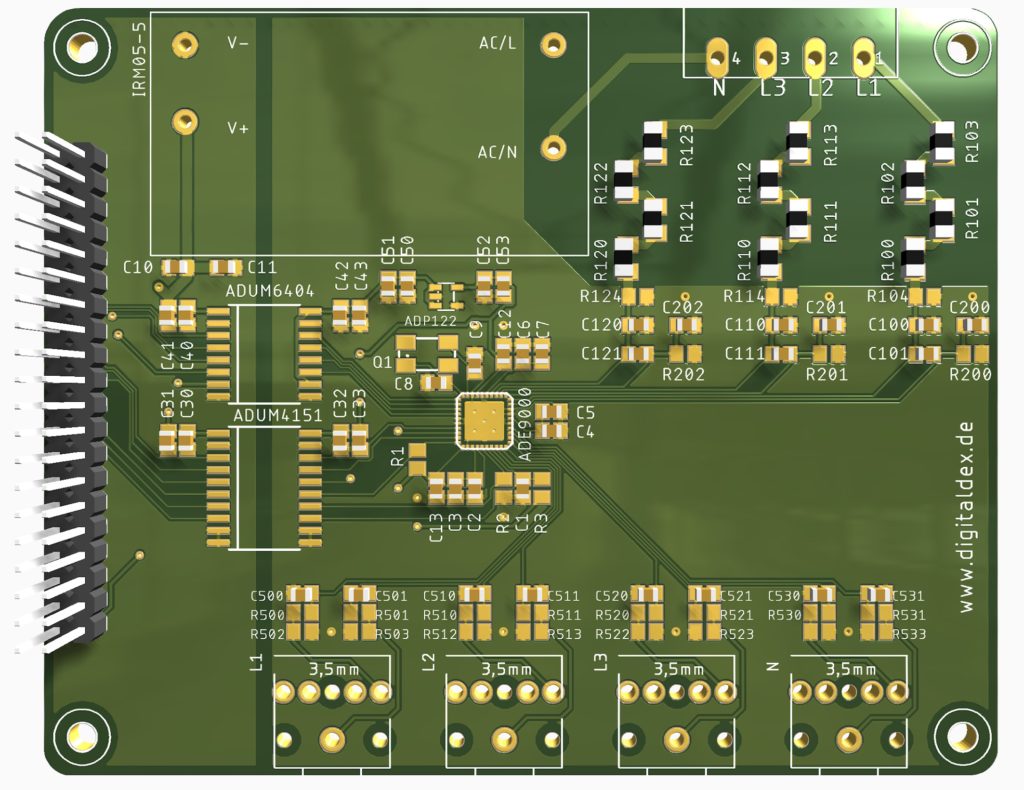
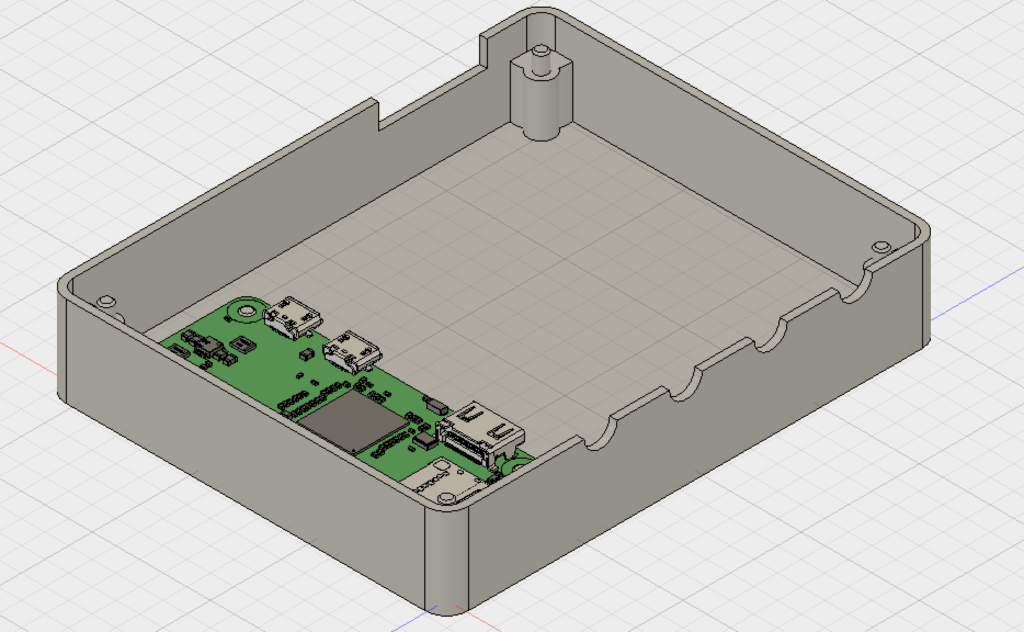
Case

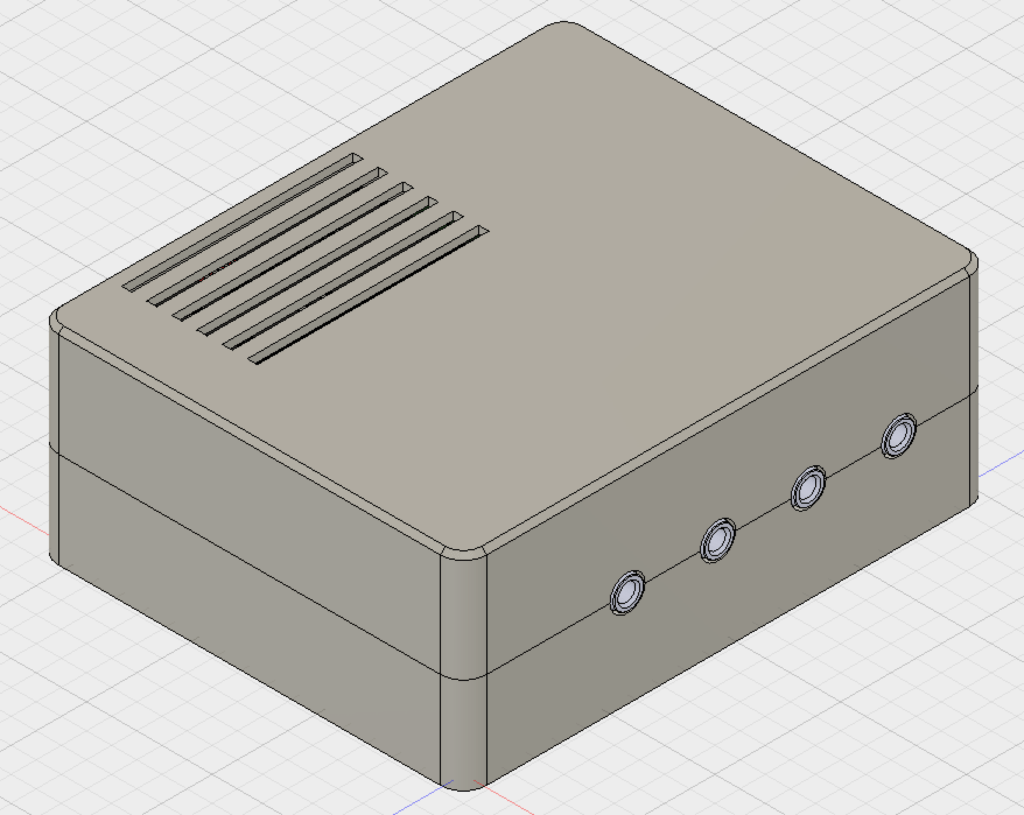
Ressources
Github
Schematics
SCT-013-000 Datasheet
ADE9000 Datasheet
BCM2835 SPI Lib
Disclaimer
Working with 230V is dangerous. The board has no protection against accidental contact. I accept no liability for damage to persons or property resulting from the reproduction of the meter.


Schreibe einen Kommentar